RD Performance Metrics
Overview
These dashboards show you key statistics from the past year, which will give visibility into metrics. To view your metrics dashboard, log in to the Provider Portal and select the “Metrics” tab.
The metrics provided within this data cover three of the pillars of our patient care: patient satisfaction (do patients rate Nourish highly?), patient retention (do they come back and see their RD?), and patient outcomes (do they make progress on their health outcomes?). While there are plenty of unique situations that impact these metrics, when considered holistically over the course of a year and compared across data from hundreds of providers and tens of thousands of patients, exceptions tend to even out and you can get a general idea of how things are going with your patients. Top RDs are eligible performance-based compensation when payer rates allow for it.
Session Performance Dashboard:
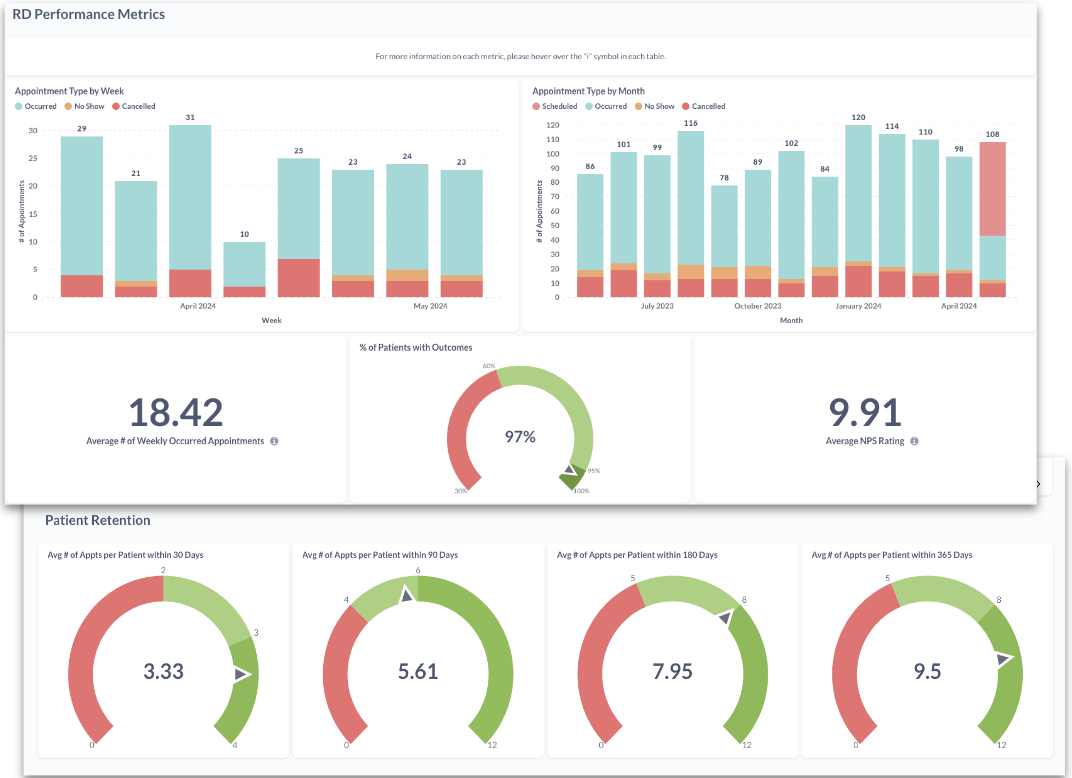
Performance metrics will have gauges that show where you stand on each metric, with red being below expectations, light green being fulfills expectations, and dark green being above expectations.
All cutoffs are based on existing data, and account for typical averages of patients leaving due to insurance, personal issues, or emergencies. As a reminder, full-time RDs must average a caseload of at least 15 occurred appointments per week.
Dashboard Item | Below Expectations | Above Expectations | Description |
Monthly Appointments by Type | — | — | Monthly count of appointments, broken down by appointment type (initial appointment vs. follow-up appointment.) for trailing 12 months. |
Weekly Appointments by Type | — | — | Weekly count of appointments, broken down by appointment type (initial appointment vs. follow-up appointment.) for trailing 8 weeks. |
Annual Appts per Week | — | — | Average # of occurred appointments per week worked at Nourish. Note: new week starts on Monday so for newer RDs will be more accurate later in the week. |
% of Patients with Outcomes | 60% | 95% | % of your patients that have at least 2 health outcome submissions (either collected by the RD or submitted directly by the patient through the patient portal) in order to track health outcomes progress |
Average 0 - 10 NPS Patient Rating | 8 | 9.6 | Average NPS rating from patients based on daily NPS survey rating going out to patients |
Avg # of Appointments per Patient within 30 Days | 2 | 3 | Average # of appointments a patient completes with you within 30 days after their initial appt |
Avg # of Appointments per Patient within 90 Days | 4 | 6 | Average # of appointments a patient completes with you within 90 days after their initial appt |
Avg # of Appointments per Patient within 180 Days | 5 | 8 | Average # of appointments a patient completes with you within 180 days after their initial appt |
Avg # of Appointments per Patient within 366 Days | 7 | 10 | Average # of appointments a patient completes with you within 365 days after their initial appt |
Patient Health Outcomes Dashboard:
To view your Patient Health Outcomes dashboard, log in to the Provider Portal and select the “Metrics” tab.
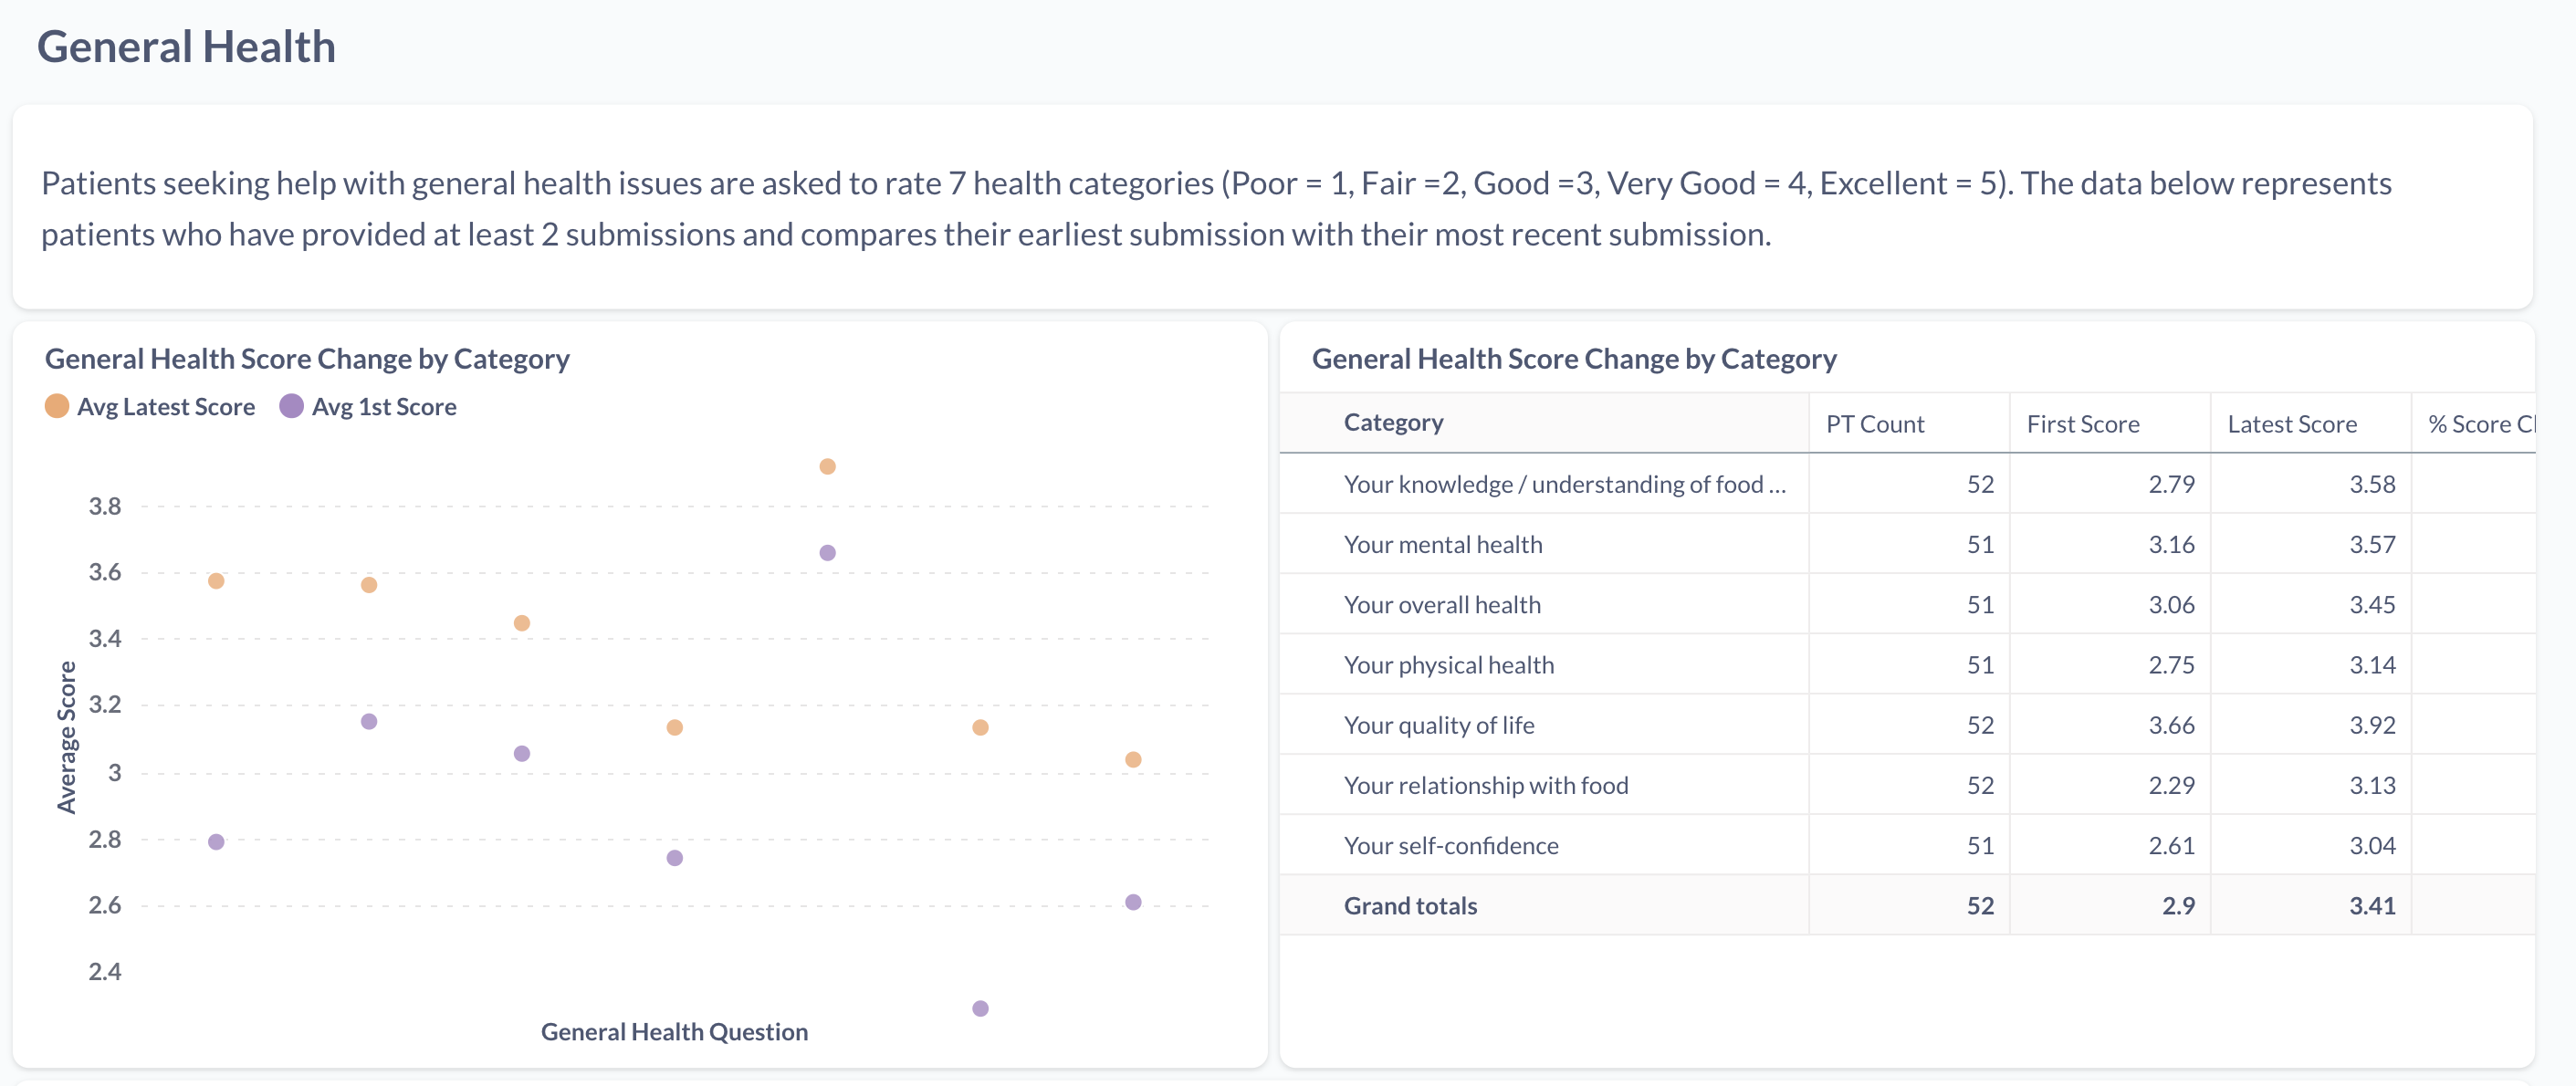
In the health outcomes tab, you can see a summarized view of health outcomes across all your patients in the provider portal. Meaning, you can see data on how much you help improve things such as Time in Range (%), General Health scores, Gut Health symptoms, etc. across all your patients (active and previous).
As long as your patients have provided at least 2 health outcome submissions, they will be included in this dashboard since we track the change from their initial outcome submission to their most recent.
If you don't have any patients with a certain specialty (e.g., diabetes, ED) then those graphs will show up as "null" and you can disregard those tables.
Reviews:
All patients receive a post-appointment text after completing each appointment. In this text, they are asked to rate their experience 1 - 5, and then provide optional feedback on the experiment. All these ratings are considered when calculating your average patient review score, available on your provider webpage and within the Provider Portal. The text reviews received through this method are populated in your metrics tab - the text will not populate on your website.
Separately, patients can also leave public reviews on your webpage, either through the patient app or the patient portal. To do so, they navigate to the home page, select the three dots next to the provider name, and choose to leave a review. All 5-star reviews with text will be populated to the website within 24 hours.


